| Attention: 1). The experiment conditions for different cell lines are shown in Table 1. The corresponding transfection protocols can be got by entering links in Table 1.
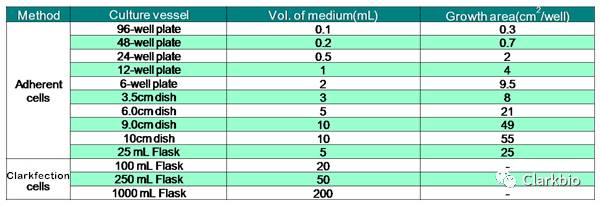
(2). Number of cells per well, dosage of Clarkfection, DNA and serum-free medium for dilution are proportional to basal area per well for plates of different sizes. The basical areas for plates with different sizes are shown in Table 2. The dosage and ratio of DNA and Clarkfection should be optimized to achieve the best transfection results. Table1. Usage of Clarkfection in different cell lines(96-well plate) | Cell type | Culture medium | Cells per well | DNA | Clarkfection | Medium change after 4-6h | | 293H | DMEM | 3×10⁴ | 0.2µg | 0.5µL | DMEM+10%FBS | | 293FT | DMEM | 3×10⁴ | 0.2µg | 0.5µL | DMEM+10%FBS | | 293E | DMEM | 3×10⁴ | 0.2µg | 0.5µL | DMEM+10%FBS | | 293F | DMEM | 3×10⁴ | 0.2µg | 0.5µL | DMEM+10%FBS | | COS7 | DMEM | 1.5×10⁴ | 0.4µg | 0.5µL | DMEM+10%FBS | | hela | DMEM | 2×10⁴ | 0.3µg | 0.5µL | 1640+15%FBS | | Caco2 | MEM | 3.5×10⁴ | 0.3µg | 0.75µL | MEM+10%FBS | | BHK21 | MEM | 2×10⁴ | 0.2µg | 0.5µL | MEM+10%FBS | | CHO-DG44 | DMEM+HT+pro | 2×10⁴ | 0.5µg | 0.5µL | DMEM+HT+pro +10%FBS | | RAW264.7 | DMEM | 3×10⁴ | 0.2µg | 0.5µL | DMEM +10%FBS | | MCF7 | MEM/NEAA+0.01mg/mL insulin + sodium pyruvat | 2×10⁴ | 0.1µg | 0.25µL | MEM/NEAA+0.01mg/mL insulin + sodium pyruvat+10%FBS | | SW480 | IMDM | 3×10⁴ | 0.4µg | 0.5µL | IMDM +10%FBS | | MDCK | DMEM | 4×10⁴ | 0.6µg | 1µL | DMEM+10%FBS | | CHO-K1 | IMDM+Pro | 3×10⁴ | 0.2µg | 0.5µL | IMDM+Pro +10%FBS | | HepG2 | DMEM | 3×10⁴ | 0.5µg | 0.75µL | DMEM+10%FBS | | A549 | DMEM | 2×10⁴ | 0.3µg | 0.5µL | DMEM+10%FBS | | NIH/3T3 | DMEM | 1.5×10⁴ | 0.1µg | 0.75µL | DMEM+10%FBS | | vero | DMEM | 3×10⁴ | 0.3µg | 0.75µL | DMEM+10%FBS | | sf9 | SIM SF | 5×10⁴ | 0.4µg | 0.75µL | SIM SF+10%FBS | Table 2. Scaling up or down transfections with Clarkfection(according to the growth area).
Note: the actual conditions should be optimized by experiments. 
|  Clark 转染试剂 1ml
 转染试剂套装,用于CHO细胞表达转染,可支撑1L培养。含转染试剂和转染用培养基
 转染试剂(溶液),转染试剂(溶液)厂商,转染试剂(溶液)市场价
 GenXP Ⅲ 基因转染试剂/转染转染试剂|
 GenXP Ⅱ 基因转染试剂/转染转染试剂
 GenXP Ⅰ 基因转染试剂/转染/转染试剂
 DNAGX转染试剂用于真核细胞转染体外/内转染DNAHitrans Reagent
 转染试剂-HepG3,适用于HepG2细胞转染,效果比LP3000好,近似电转染效率/EndofectinTM - HepG2北京代理
 磷酸钙法细胞转染试剂盒现货供应,进口磷酸钙法细胞转染试剂盒
 DEAE-Dextran细胞转染试剂盒现货供应,进口DEAE-Dextran细胞转染试剂盒
 德国biontex细胞转染试剂/METAFECTENE EASY+第三代DNA快速细胞转染试剂
 GX电转染试剂E(核转染)难转细胞不再难转!